Performance Monitoring
4. Service Performance Overview
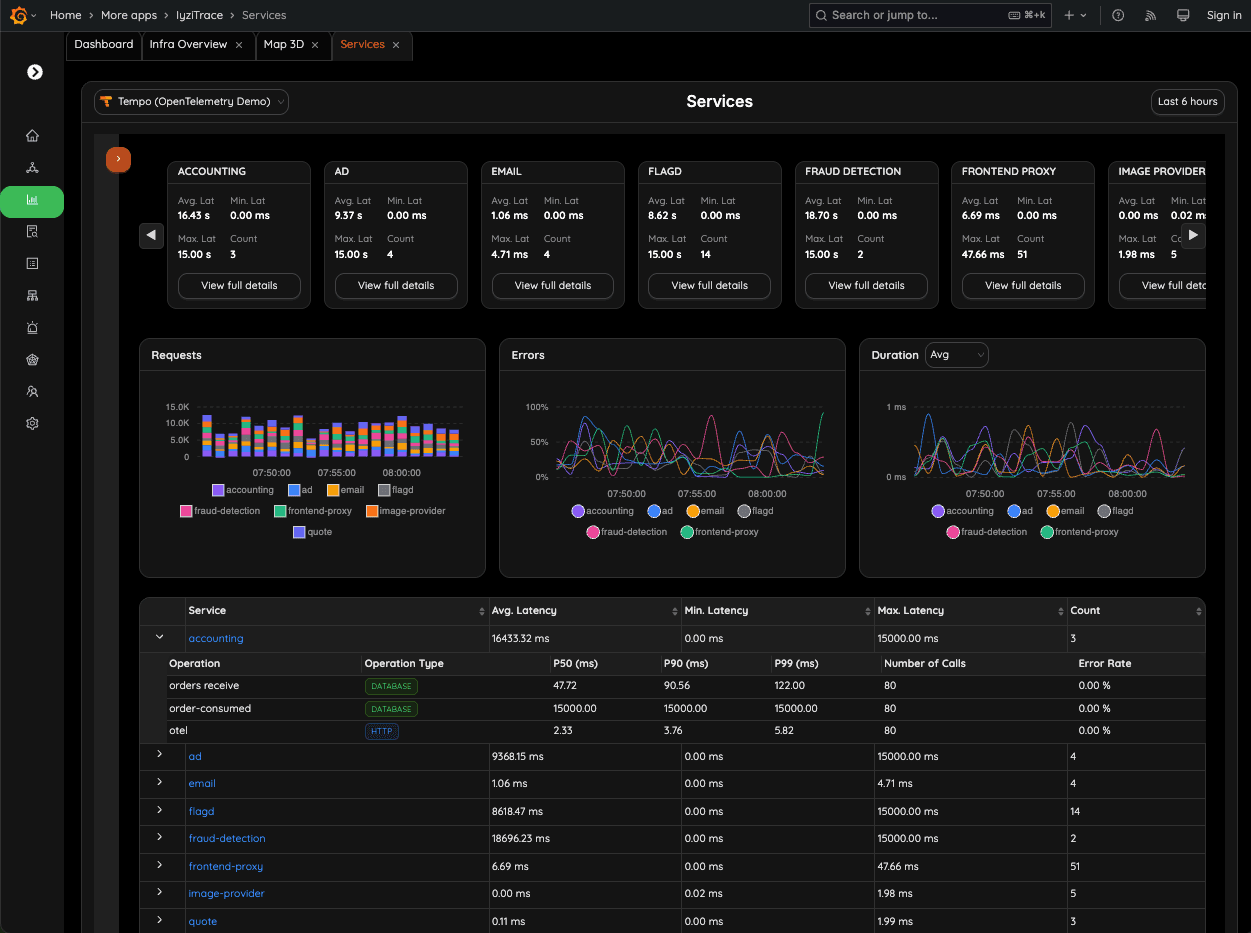
Track latency, error rates, traffic volume, and performance metrics across all services. The overview dashboard gives you a real-time picture of system behavior across your entire stack.
- Real-time metrics display
- Aggregated performance data
- System-wide health snapshot
- Traffic pattern analysis
5. Service-Level Metrics
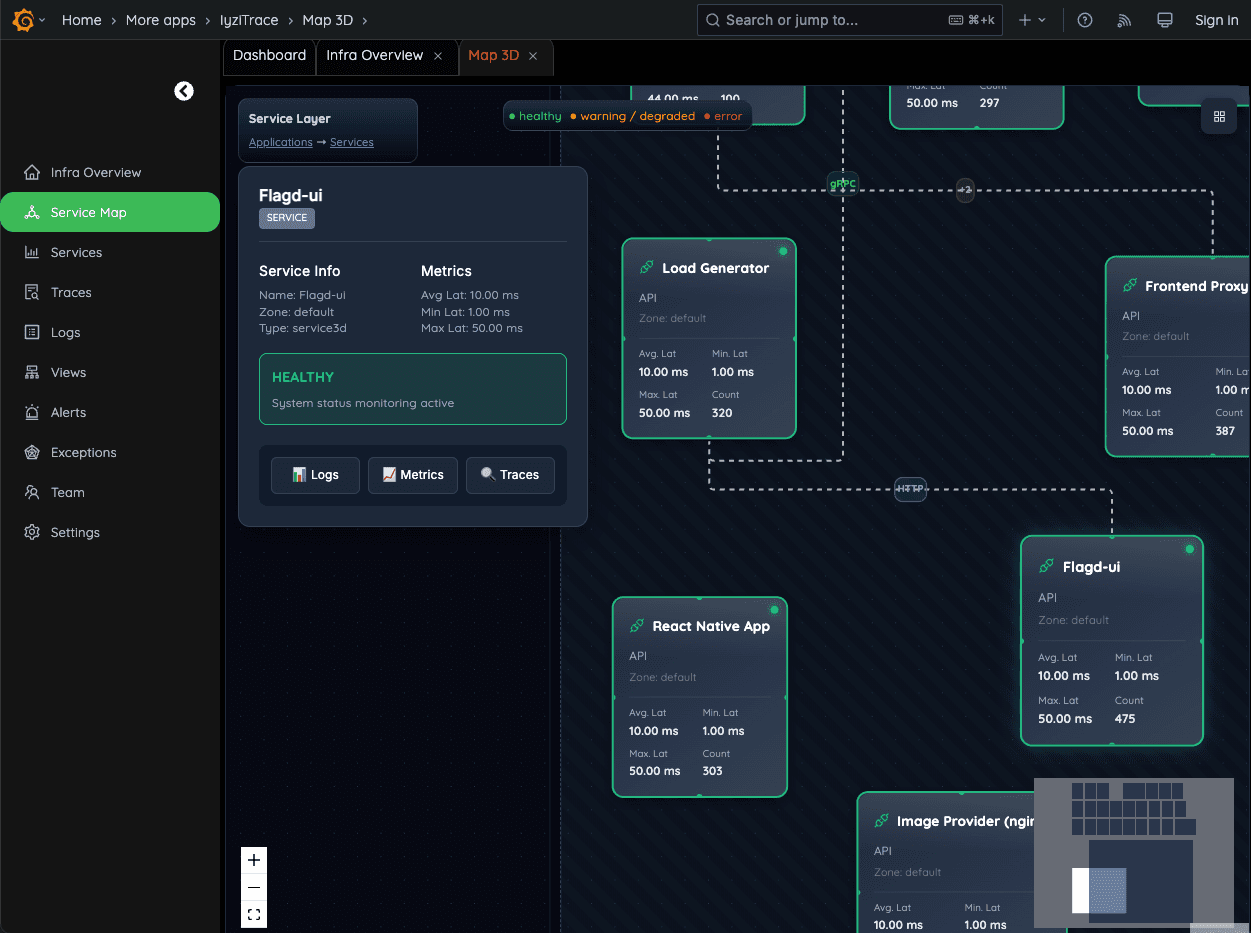
Open a single service to inspect its health, error rate and latency (avg, min, max). From here you can jump directly to logs, metrics or traces for faster root cause analysis.
- Detailed service health
- Error rate tracking
- Latency analysis (avg, min, max)
- Quick navigation to related data
6. Service Detail – Call Metrics
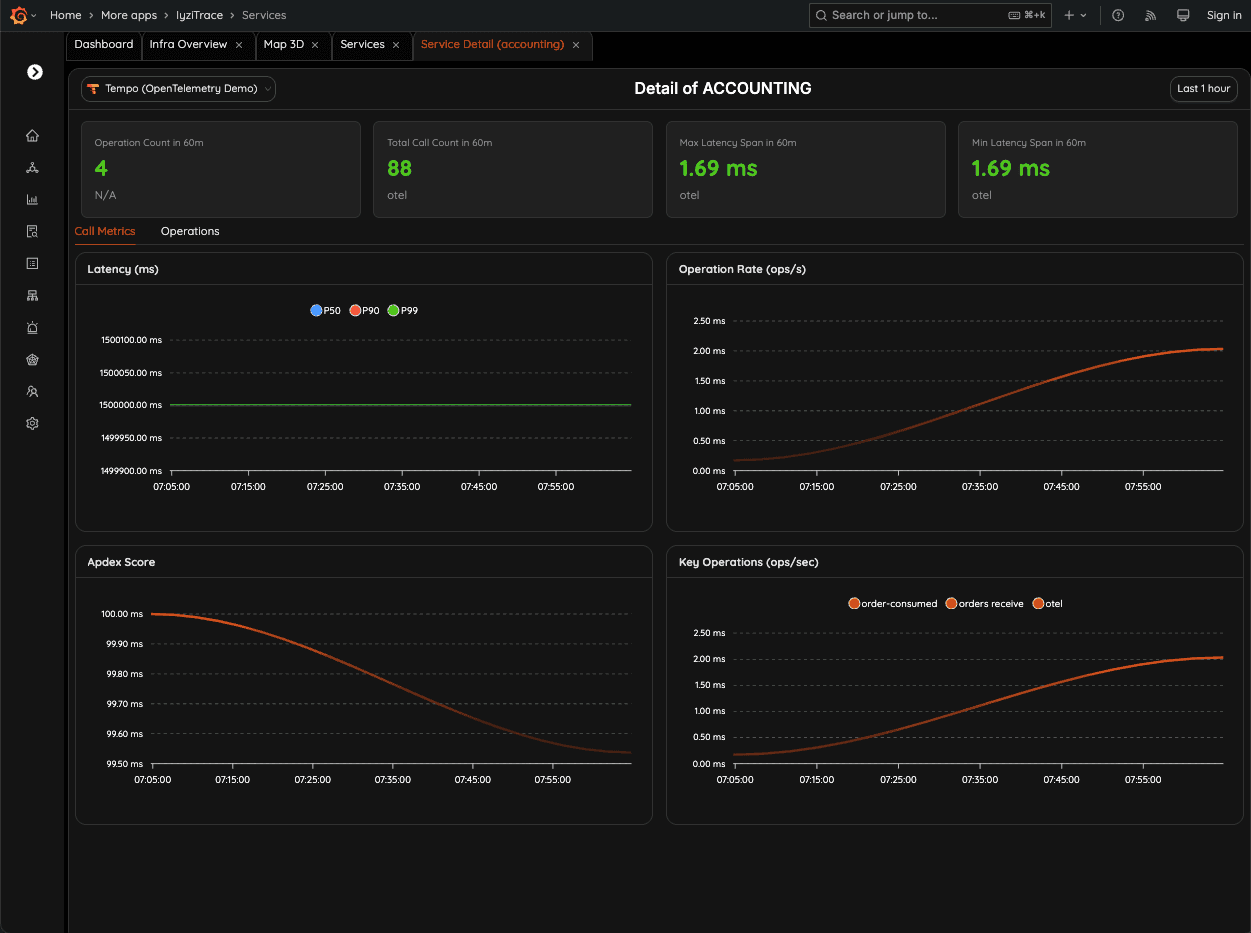
Analyze detailed call metrics for the selected service, including latency percentiles (P50, P90, P99), throughput, and performance anomalies over time.
- Latency percentiles
- Throughput analysis
- Performance anomaly detection
- Time-series visualization
7. Service Detail – Operations Insight
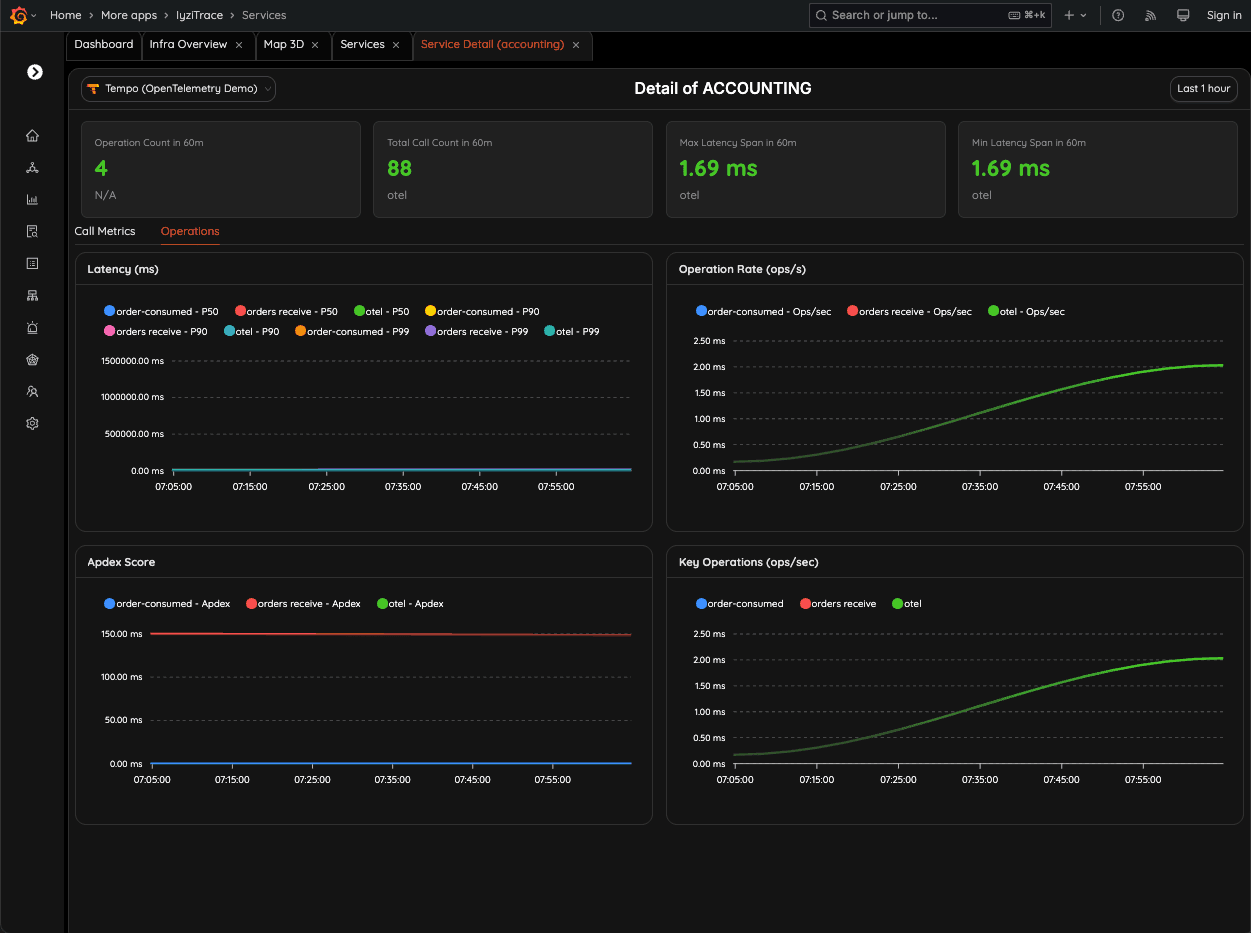
Dive into operation-level performance for a service. Monitor latency, APDEX scores, and operations-per-second to detect regressions or spikes instantly.
- Operation-level metrics
- APDEX scoring
- Regression detection
- Spike identification
8. Operation-Level Insight
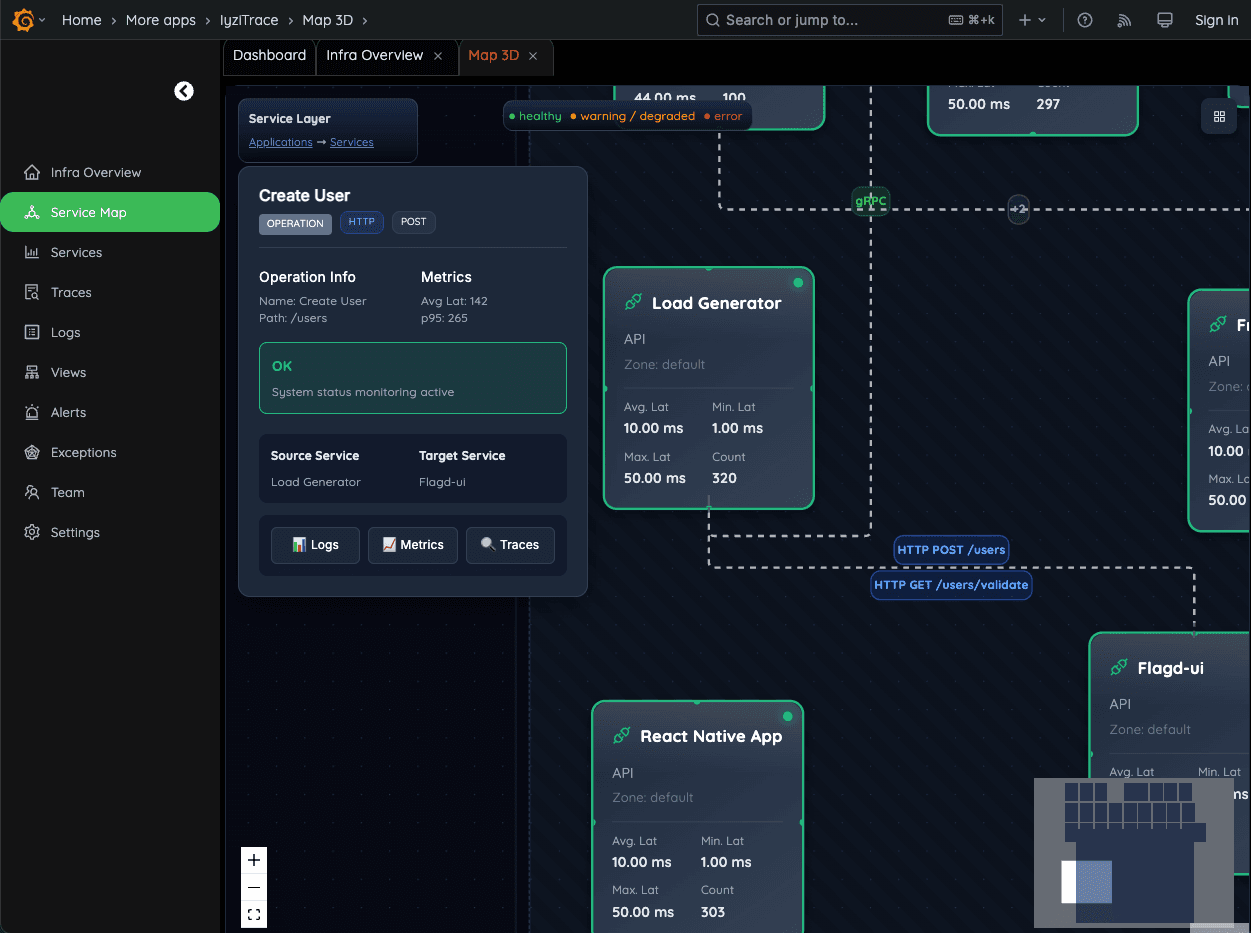
Monitor each operation such as "Create User" with its own latency and P95 metrics. See which source and target services are involved in every call.
- Per-operation metrics
- P95 latency tracking
- Source-target service mapping
- Operation health monitoring
9. Operation Detail – Update Profile
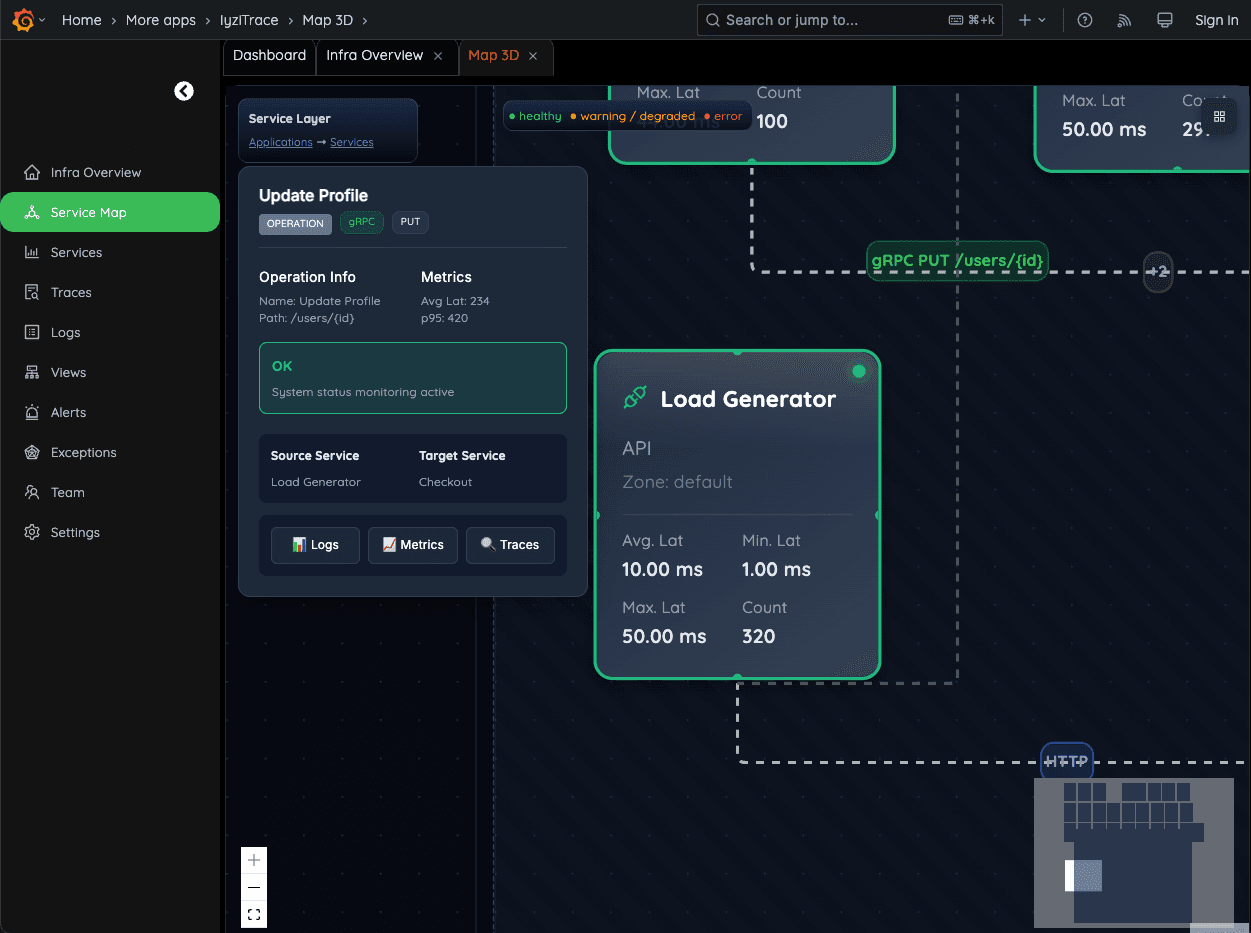
Inspect the full execution of specific operations, including latency (avg/p95), HTTP/gRPC method, and source–target service path. Quickly identify bottlenecks in user-facing flows.
- Full operation execution details
- HTTP/gRPC method inspection
- Service path visualization
- Bottleneck identification